Important milestone for Farmable users: profitability per field
When me and my colleagues started farming in 2014, we started building our own planning and documentation systems. In 2018, we founded Farmable to create a globally scalable product based on our own prototypes. Now, 8 years after starting farming, and 4 years after creating a tech startup, we can finally estimate what we were always working towards; profitability per field.
The complexity lies in being structured about allocating costs to the right fields. At our farm, we have 27 fields where labor hours, product costs, and revenue from crop sales are spread out in different ways across the 27 fields. One invoice might relate to anywhere between 1 and 27 fields, so keeping track of allocations was tough. We were pretty structured with data, and we are good friends with Excel – but we failed miserably at keeping control of revenue and cost per field.
We don’t need to worry about this anymore – profitability estimation is now fully automated just because we have used all the Farmable features consistently throughout this season:
- All harvests are registered for all fields with the free harvest feature. And all sales are registered with the premium Sales Management feature. This means we capture revenue per sale, including information about quality, customers, fields, and varieties – even picker teams.
- All pesticides, herbicides, and fertilizers are registered with purchase costs, and the consumption of each product per field is taken directly from the spray and fertilizer logs. This feature is part of the free basic version of Farmable and will populate in all users profitability graphs.
- All our permanent crew and season staff have registered their hours in Farmable´s premium Teams & Timesheets module this season. This enables the allocation of hours to fields and jobs.
For our own farming operation, labor cost and product cost constitute the two largest cost items, and therefore we think the current profitability estimate is pretty good. At Farmable, we will continue to include more cost items in the future and thereby improve the accuracy of the estimate.
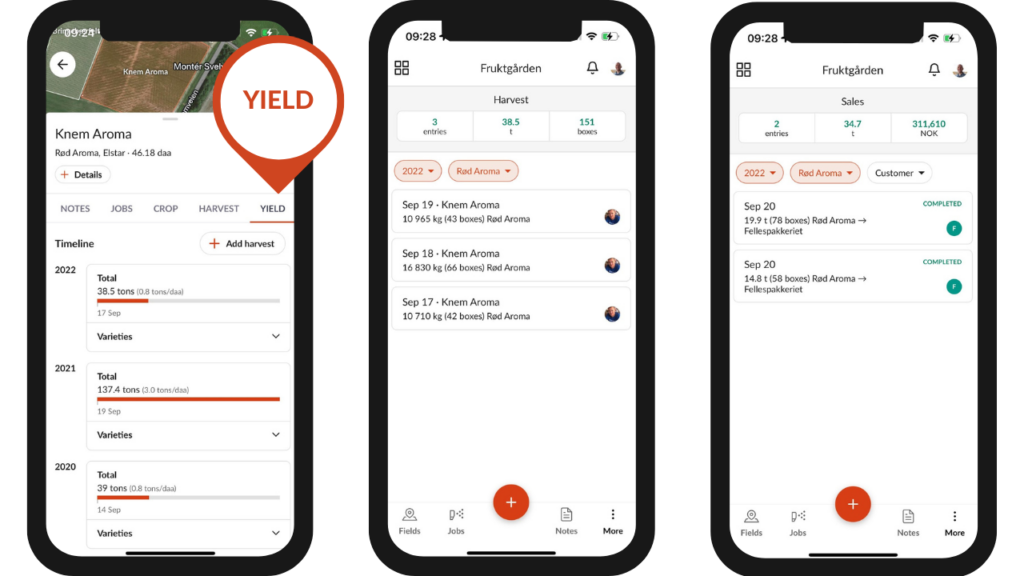
As an example, let’s look at our apple field of the variety Red Aroma. As the yield history shows, we had a significant volume drop from 137 tons last year to 38 tons this year. The reason is cold weather during the flowering season, so pollination suffered.
We harvested this field for three days, starting September 17. 35 tons were delivered to the customer’s packhouse by two truckloads on September 20, and 3 tons remain in storage for later juice production.

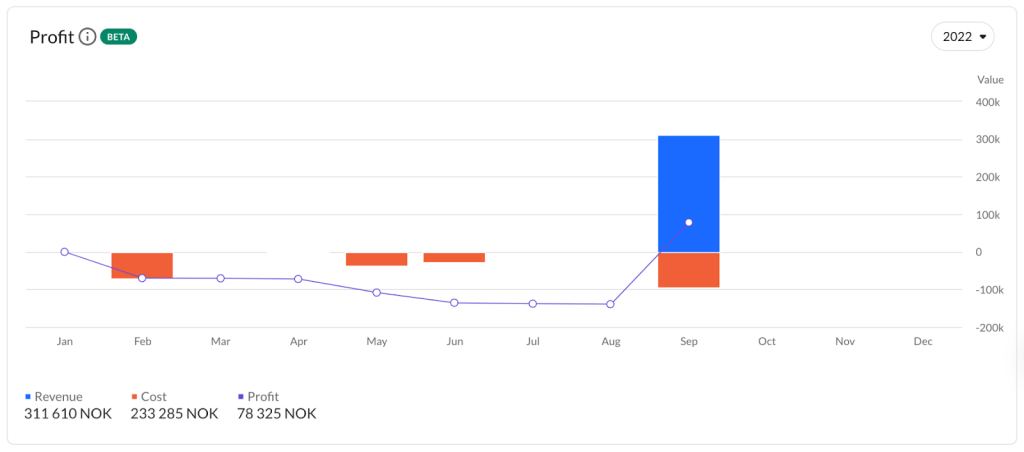
The revenue from the 35 tons is estimated at NOK 311 000 from the sales registrations. The labor costs for this field come from two main tasks; pruning in February and harvesting in September. In addition, there are some costs related to spraying and fertilizing in May and June. In total, this leaves a profit of NOK 78 000.

We have never had transparency on cost and revenue like this before, and we already see it gives better decision basis for the future of our farm:
- What tasks drive costs?
- Where to focus on cost-cutting initiatives?
- What varieties to plant more of?
- When to replant a field?
The visualization of profitability is available to all users in the Web Portal, but the use of the Teams and Timesheets module and Sales Management module is necessary to get a decent estimate.

