
Built on the Farmable API
Your farm data. Shaped your way.
This is a custom dashboard built on Farmable records: blocks and boundaries, spray and fertilisation logs, input usage, harvest, scouting notes and labour hours. Filter it, reorder it, hide what you do not need. It runs on demo data, but the structure is exactly what the Farmable API exposes for a real operation.
The idea
Your records were never locked in.
Farmable's built-in reports and exports cover what most farms need day to day: spray journals, harvest summaries, audit documents. But some operations want their farm data sitting next to everything else they run on, in a view they designed themselves.
That is what the API is for. Because every record is structured and grower-consented, your own team or a developer you work with can read it and build exactly the view you want. This page is one example of what that looks like.
→ Read the technical overviewThe dashboard
Any report you want, designed for your business.
Change the time range, filter and sort each card, or drag the cards into the order that suits how you work. Your layout is remembered in this browser. Everything here reads sample data.
Blocks & boundaries
Loading demo data...
Work log
Loading demo data...
Input register
Loading demo data...
Harvest
Loading demo data...
Scouting
Loading demo data...
Labour
Loading demo data...
Ask your data
Ask your data anything.
A dashboard built on the API can put a query box in front of your records. This one answers the four questions below from the sample data on this page.
Every number traces back to a job, a block and a date.
Nothing on this page is a standalone figure. Each harvest weight, each product quantity, each labour hour sits on a specific job, on a specific block, on a specific date, recorded by the crew at the time. That traceable structure is what an audit export needs.
A dashboard like this one can generate that export directly, in the format your certification body or buyer asks for, instead of someone rebuilding it from spreadsheets the week before the audit.
How it's built
Three steps, no rebuilding.
You record it once
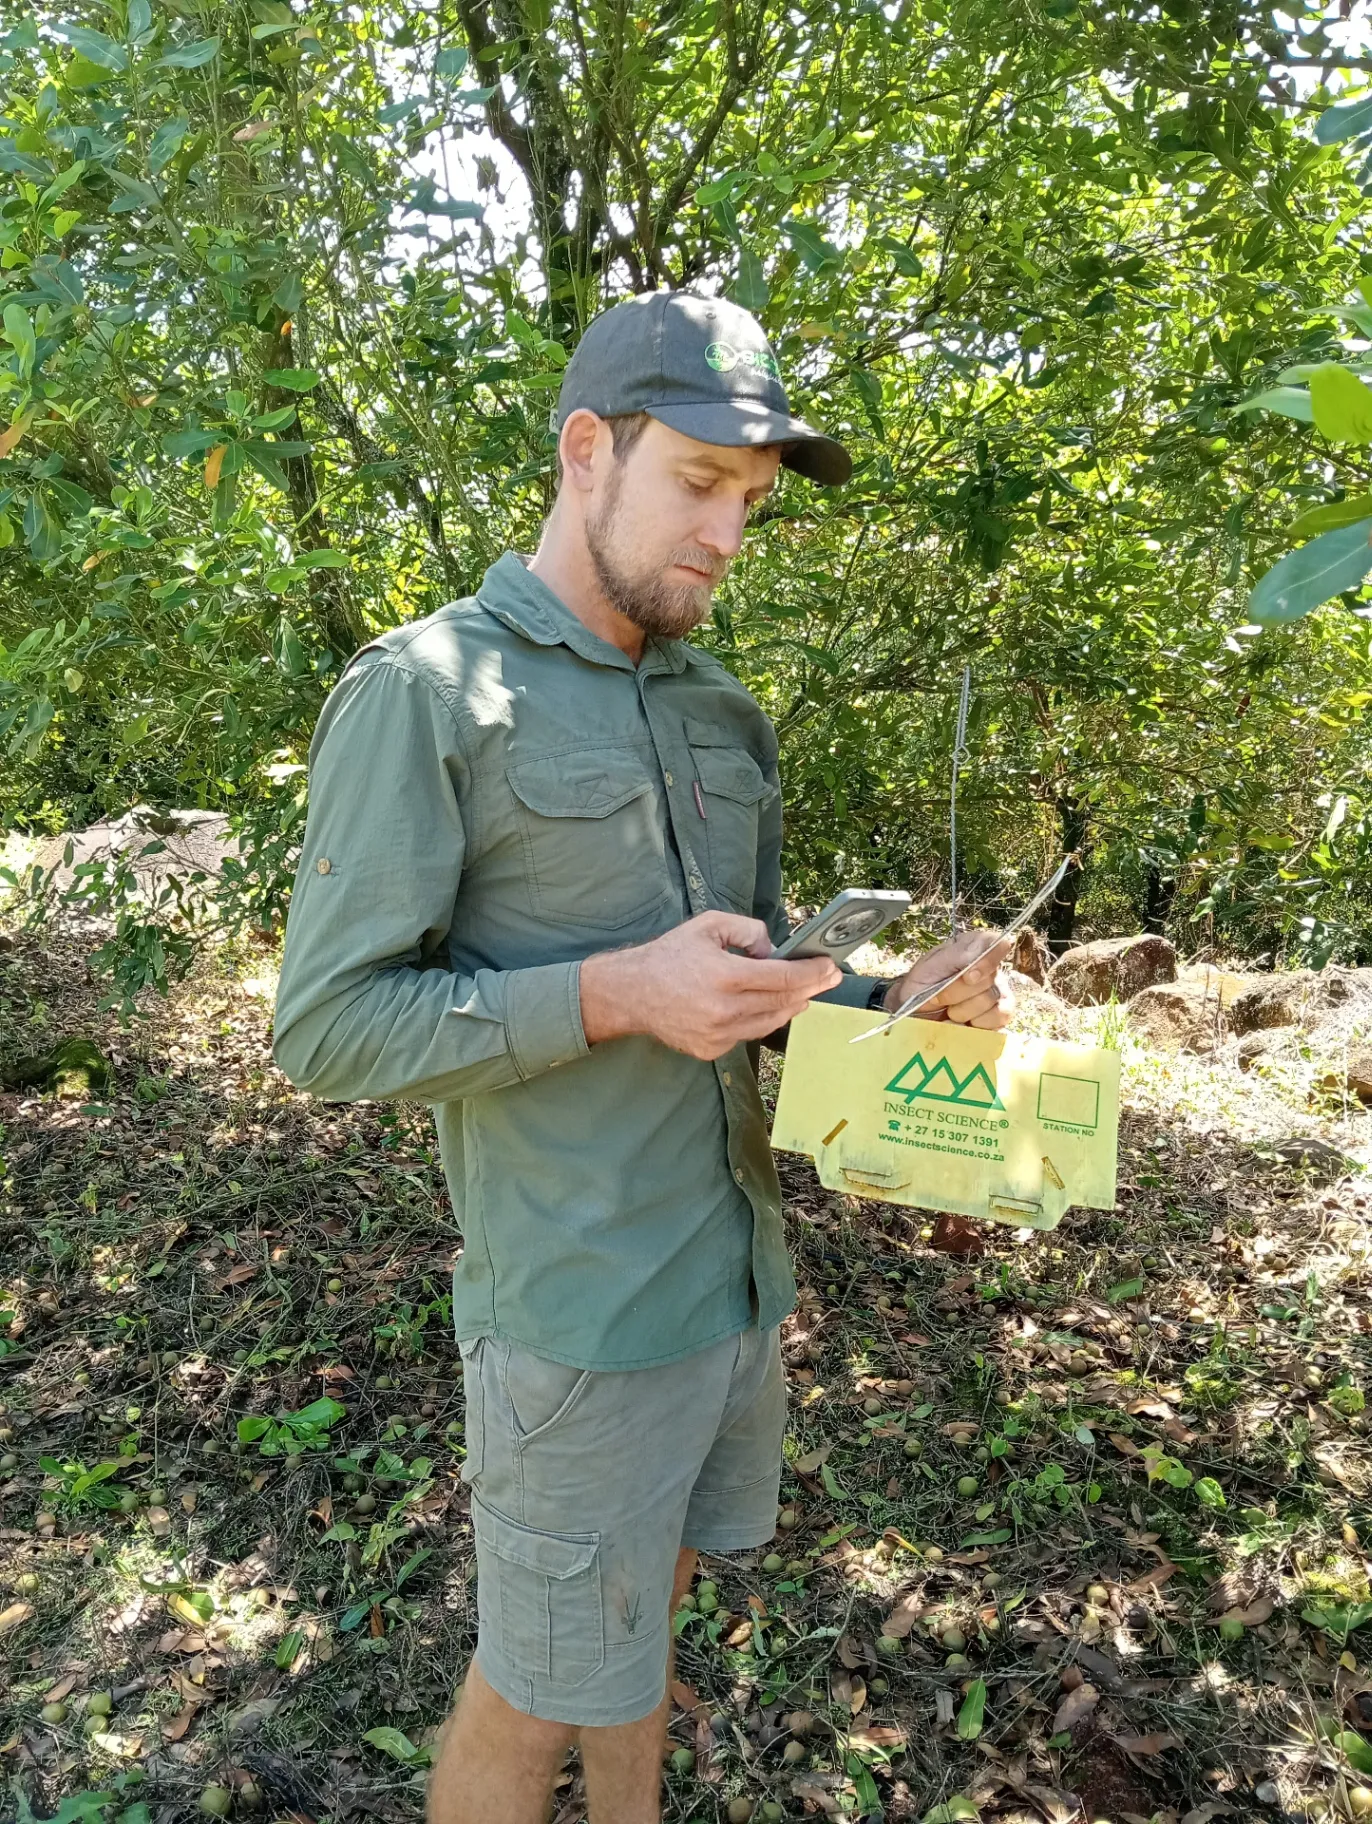
Your crew logs the job on a phone in the field, as it happens: what was applied, where, why and how long it took.
The API exposes it, with your consent
You choose what is shared and with whom. Nothing leaves your account without your explicit authorisation inside Farmable.
→ How consent worksIt becomes whatever you need
A developer reads the data and builds the view: a dashboard like this one, a board report, a buyer-ready export.
Your turn
Build your custom farm data tool.
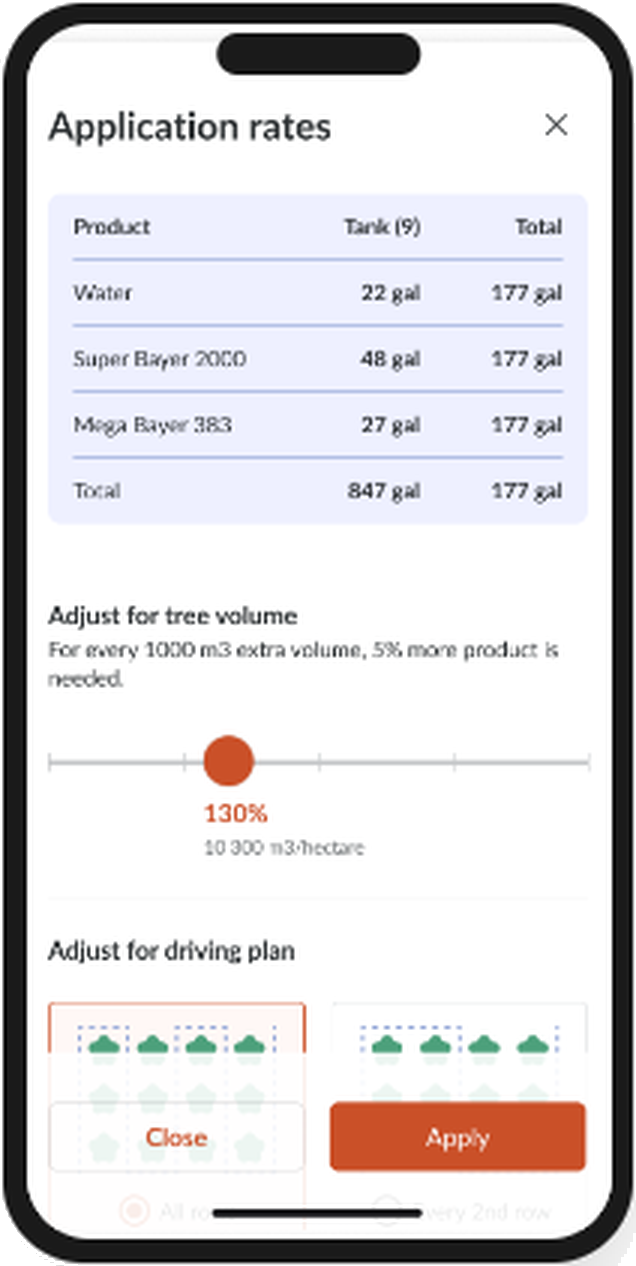
Farmable captures it, you shape it. Your crew logs sprays, harvest, scouting and hours on a phone in the orchard. The records stay yours, structured and audit-ready, and a dashboard like this one is an afternoon's work on top of them. No spreadsheets, no data entry evenings.
- Draw every block once, on the map, in the field.
- Log the job as you do it: product, rate, block, weather, operator.
- Pull the report the auditor asks for, in one click.
Questions
Custom dashboards, answered.
Yes. Everything you record in Farmable, blocks and boundaries, spray and fertilisation jobs, input usage, harvest, scouting notes and labour hours, can be read through the Farmable API. API access is arranged with us, and pulling a farm's records always requires that farm's explicit consent inside Farmable. From there your own team or a developer you work with can shape the data into whatever view you need.